European investment fund AUM reached a record €25.2 trillion in 2025.¹ UCITS funds are sold in more than 50 countries outside the EU.² European households committed €295 billion net to funds in 2025, an all-time high.¹ The scale of the distribution industry is extraordinary. The quality of the data most asset managers use to navigate it is not.
In a market where AUM concentration is increasing, where growth from market beta is structurally harder, and where product differentiation is compressing, the managers who grow are increasingly those who distribute better, not simply those who manage better. Yet most asset managers are working from the same distributor map they have always used. And that map is, in many cases, structurally wrong, in a way that distorts every commercial priority that flows from it.
The problem is not data quality in the conventional sense. It is a category error that has been embedded in how the industry thinks about distribution for decades.
The Legal Map and the Commercial Reality
When an asset manager asks “who do we distribute through?”, the instinctive answer is a legal one: the names of the institutions they have distribution agreements with, the group names they have relationships with, the entities that appear on their client lists. This is the legal view of distribution: who owns whom, which agreements are in place, which entities are registered as authorised intermediaries.
The legal view is real and necessary. For compliance, for counterparty agreements, for regulatory reporting, you need to know the registered entity. But for commercial decision-making, whether that is territory planning, prioritising sales effort, or identifying where fund flows actually originate, the legal view can be actively misleading.
Consider a composite example. A major Italian banking group is legally one thing: a parent entity, with asset management arms, insurance subsidiaries, and banking divisions, all consolidated on a group balance sheet. From a legal targeting perspective, it looks like one distribution relationship. From a commercial perspective, it is three entirely different businesses. The captive asset management arm manages the group's proprietary funds and is not a distribution opportunity for a third-party manager at all. The tied adviser network operates as a sales force for high-net-worth clients with an active appetite for curated external products. The branch banking network distributes bancassurance products to mass-market clients, a channel that is largely captive and operates under different selection criteria entirely.
A manager who targets at group level risks spending effort on the wrong entity within it. A manager who understands the commercial hierarchy, where the buying decision sits, how open it is, and what products it selects for, will concentrate effort where it can actually generate returns.
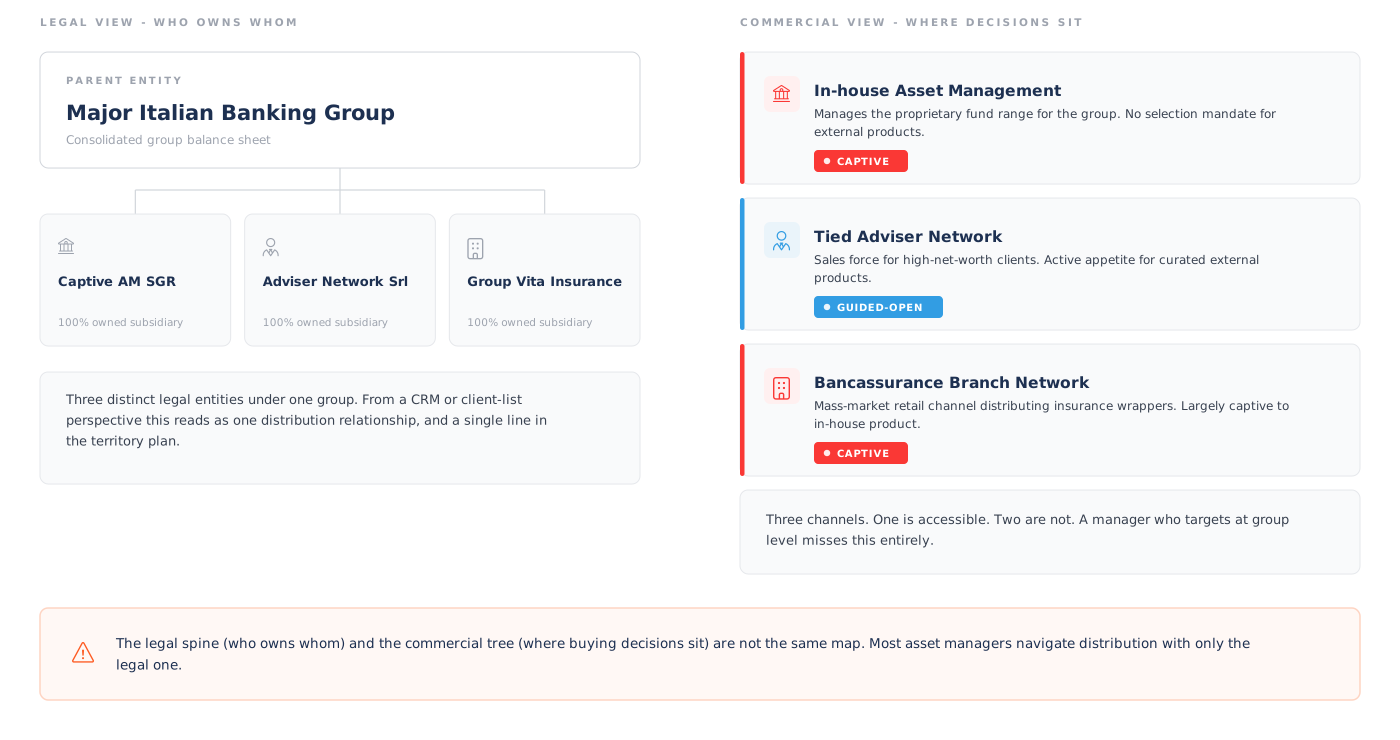
This distinction between the legal spine (who owns whom) and the commercial tree (where buying decisions sit) is not a subtle analytical nuance. It is one of the most consequential distinctions in fund distribution data, and it is rarely captured in the information most asset managers work with.
The Captive Book Illusion
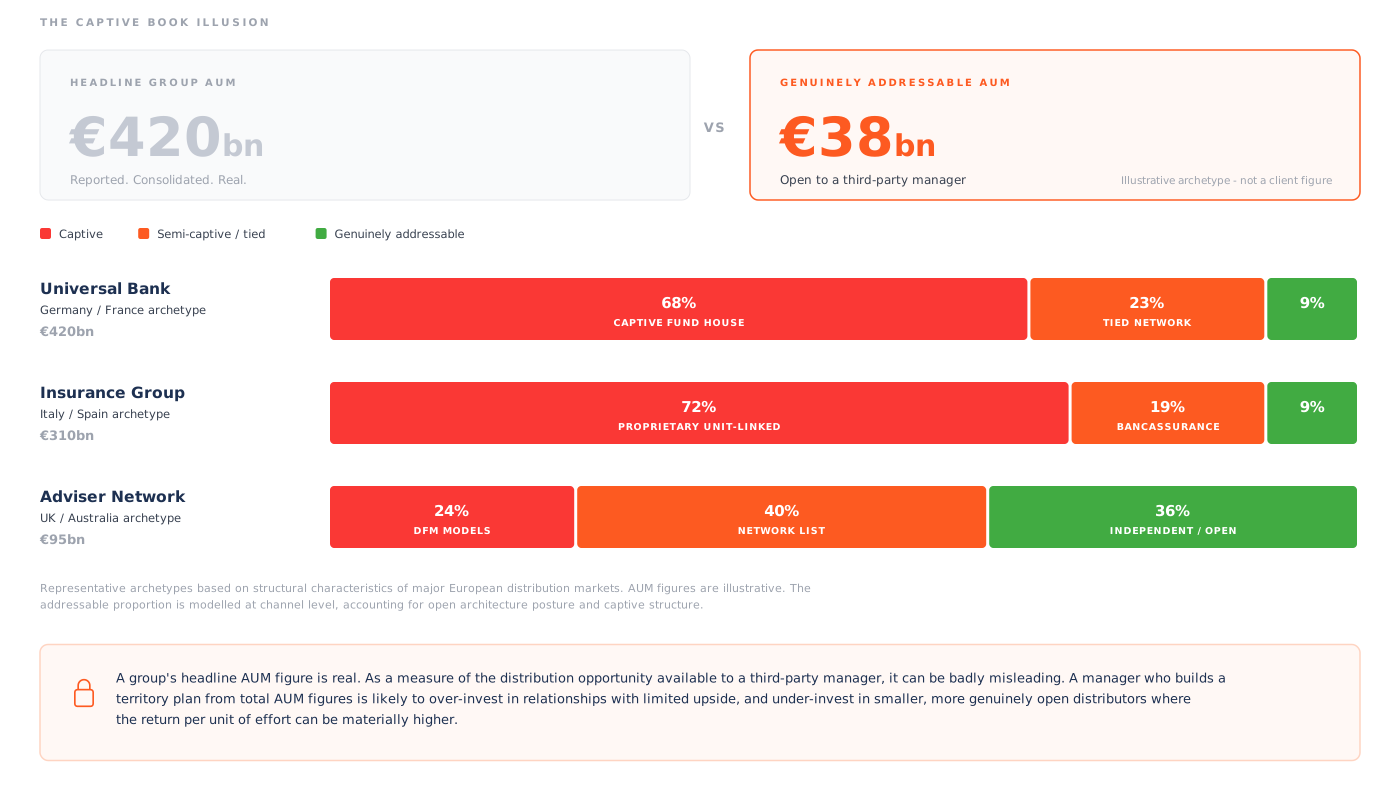
The practical consequence of confusing legal ownership with commercial distribution structure is what might be called the captive book illusion: systematically overestimating the size of the addressable opportunity.
A financial group's total AUM is a real number. As a proxy for the distribution opportunity available to a third-party manager, it can be badly misleading. In the major European fund markets of Germany, France, Italy and Spain, the dominant distribution groups hold a large share of their AUM in captive structures. DekaBank serves the Sparkassen network with Deka funds. Amundi's relationship with Crédit Agricole's retail network is primarily a proprietary one. The bancassurance arms of the major Spanish groups predominantly distribute in-house insurance wrappers.
Headline AUM, in these cases, does not reflect opportunity. It reflects a structural reality in which most of the capital is controlled by groups who distribute their own products first and third-party products selectively or not at all.
The illusion persists because open architecture is usually treated as a property of the group, and as a binary one: a distributor either has it or does not. The commercial reality is considerably more granular, and it sits at channel level rather than group level.
The spectrum runs from fully open, where a distributor actively sources from a broad universe of managers with no structural preference, through guided-open, an approved list model with active curation and genuine third-party access, to restricted, where external shelf space exists only in specific categories, and finally to captive, effectively closed to third-party products.
Within a single large group, different channels sit at entirely different points on that spectrum simultaneously: a private banking division running a guided-open model alongside a retail branch network that is structurally captive. Assessed at group level, that group looks partially open. Assessed at channel level, most of its capital is unreachable and a much smaller proportion is genuinely available. Only the second view supports a sales plan.
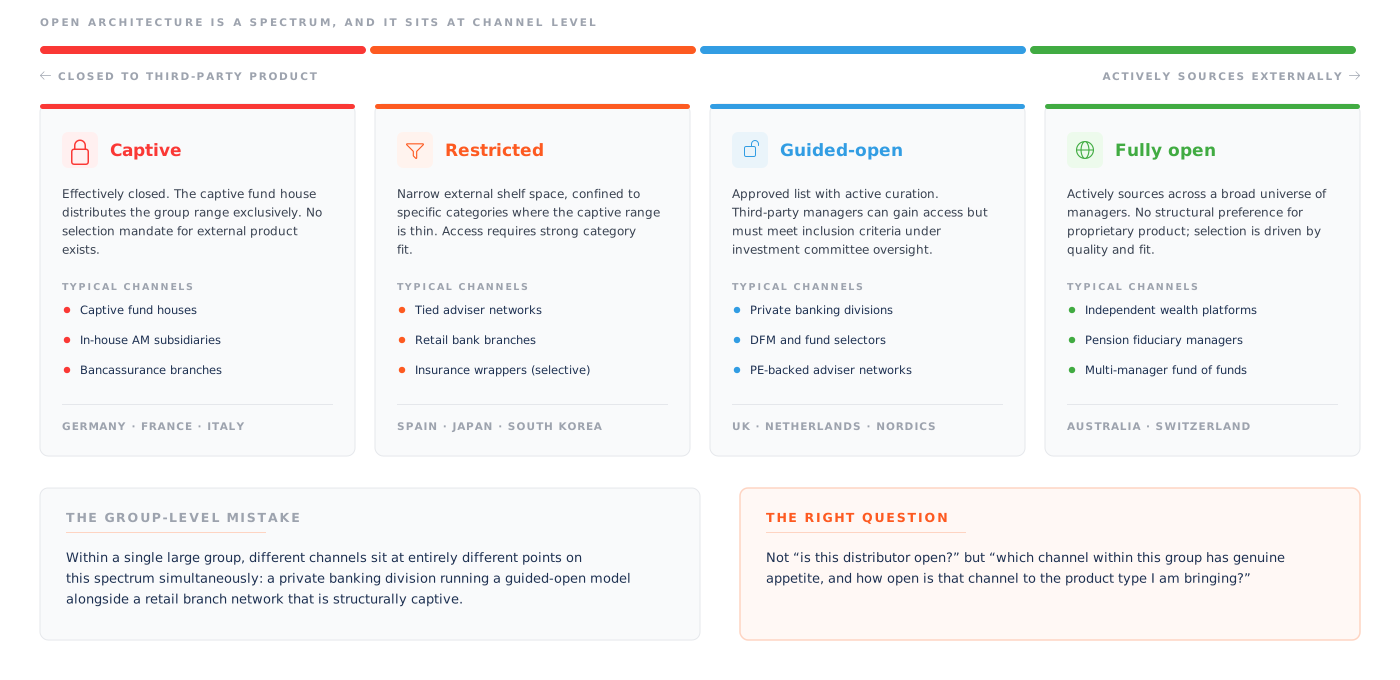
So the commercially meaningful question is not “how much AUM does this group manage?” but “which channel within this group has genuine appetite, and how open is that channel to the product type I am bringing?” That reframing produces the addressable portion: the slice shaped by open architecture posture at channel level and by the commercial reality of how each channel actually operates. In many cases it is a fraction of the headline number. A manager who builds a territory plan from total AUM figures is likely to over-invest in relationships with limited upside and under-invest in smaller, more genuinely open distributors where the commercial return per unit of effort can be materially higher.
The same logic applies to scale. A Tier 1 distributor that is captive is a worse commercial opportunity than a Tier 2 distributor with genuine open architecture, provided the manager targets the right Tier 2 organisations and does not assume that larger always means better.
The Landscape Changes Faster Than the Data That Tracks It
A third problem compounds the first two: distribution landscapes are not static, and most data sources update too slowly to reflect current commercial reality.
In the UK, PE-backed consolidation of the IFA market has been reshaping the intermediary universe for several years. Networks and firms that were independent have been absorbed into larger groups with centralised investment committee structures. The buying decision has moved up the chain. A manager targeting individual IFAs on the basis of a contact list from three years ago may be reaching advisers who no longer hold product selection authority and have delegated to a DFM or network model portfolio.
Across Continental Europe, banking sector consolidation continues to change the ownership and commercial structure of major distributors. A merger between two regional banks may consolidate distribution entities that previously made independent product selection decisions, creating a larger but potentially less accessible combined entity. An acquisition of a boutique by a major group may close an open architecture model overnight.
Outright mergers and acquisitions are only part of it. Rebrands, network re-affiliations, mandate renegotiations, and regulatory changes all affect the commercial reality of a distributor relationship in ways that are not captured by a static list of authorised firms.
A distribution strategy built on data that does not track and version these changes will drift from reality over time, and in a competitive market for shelf space the drift is not costless.
What Better Distribution Intelligence Looks Like
The managers best positioned in the current environment tend to share a common approach: they work from distribution data that separates legal ownership from commercial structure, models open architecture at the channel level rather than the group level, and treats addressable AUM as a modelled and evidenced figure rather than a headline number, updated continuously as the landscape changes.
This is not a trivial data problem. Across the 25 structurally different markets in EMEA and APAC that Aiviq covers, applying a single methodology consistently requires both scale and local intelligence. The method has to reflect how each market actually distributes, not a template pasted from the UK or Germany. The bank-distributed markets of Southern Europe, the adviser-led markets of the UK and Australia, the pension-fiduciary markets of the Netherlands and Scandinavia, and the megabank-centralised structures of Japan and South Korea each require different commercial logic to navigate. One map does not serve all of them.
The managers who build a durable distribution advantage are those who invest in understanding distribution at the right level of granularity: not the legal entity, but the commercial unit where the decision sits; not the headline AUM, but the addressable portion; not a snapshot taken at the last market mapping exercise, but a continuously maintained view that reflects how the landscape is actually evolving.
The map most managers are using is a legal one. The territory they need to navigate is a commercial one. That gap is where distribution opportunity is won and lost.
Aiviq maintains this commercial view of distribution across 25 markets in EMEA and APAC: legal ownership separated from commercial structure, open architecture modelled at channel level, and addressable AUM evidenced rather than assumed. If you want to see how it compares with the map your team is working from today, get in touch.
Sources
- EFAMA, Fact Book 2026: Trends in European Investment Funds, 24th Edition, 2026
- EFAMA, Market Insights: UCITS, a global success story - The distribution of UCITS outside of Europe, September 2025 (2024 data)